Project Management Timeline Template in Excel: How to Build One That Actually Works

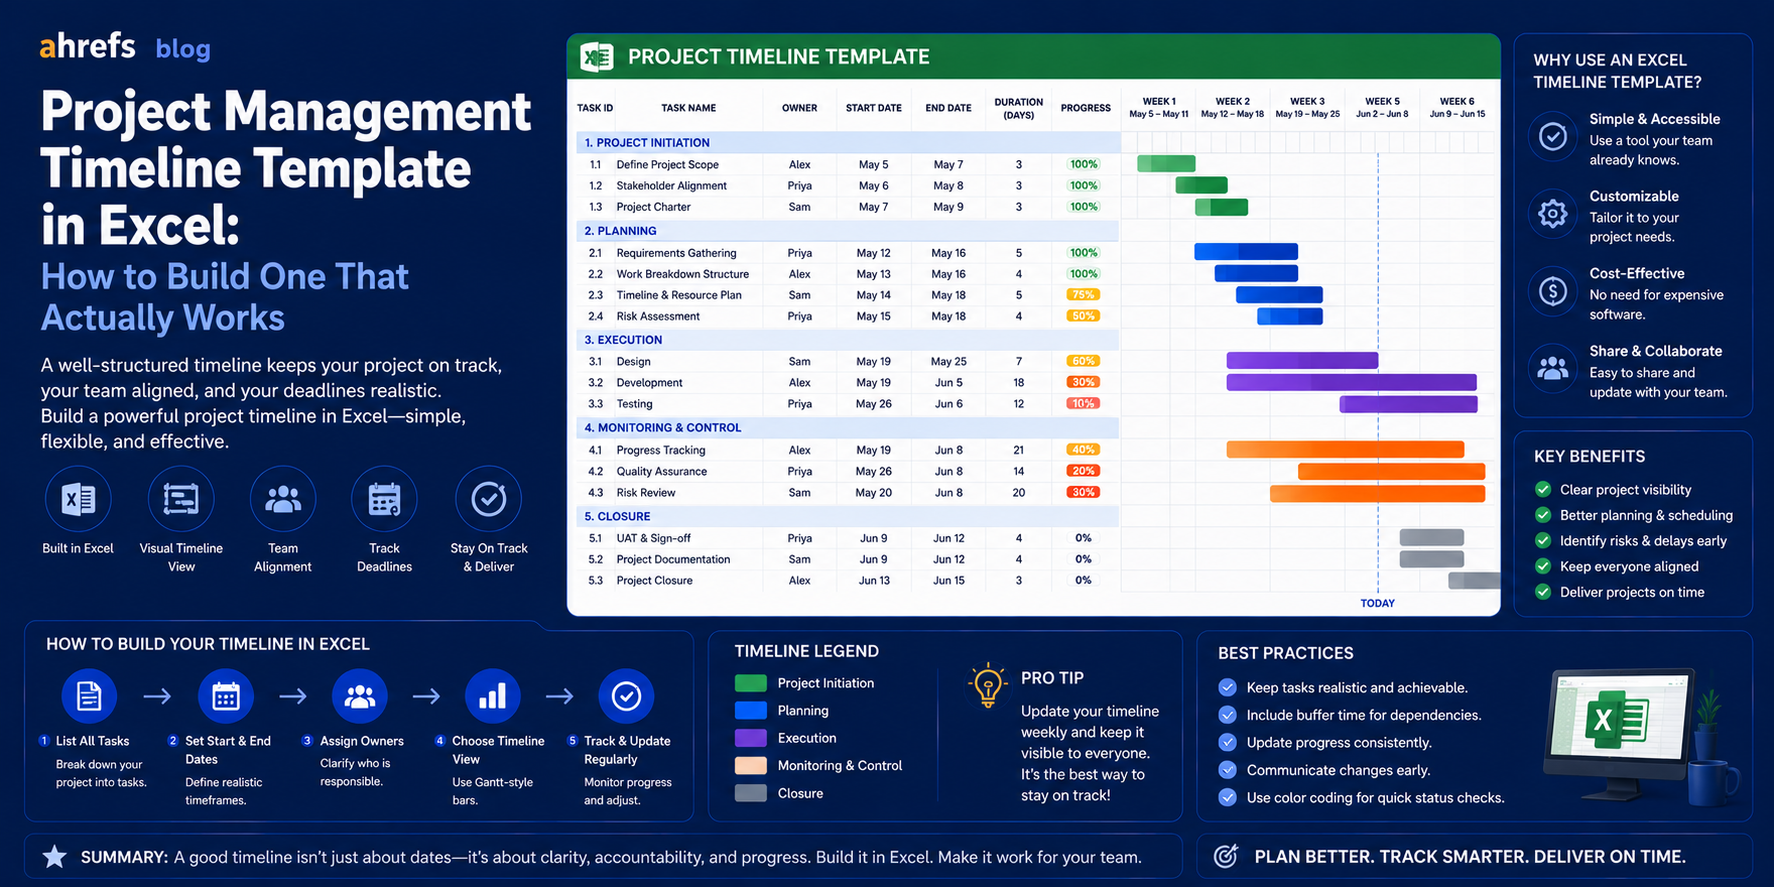
Although Excel is not a project management tool, it is the most popular one worldwide when it comes to creating a project timeline. It is available everywhere, versatile, and, with the appropriate set-up, generates a well-structured and easily shared Gantt chart. The following steps will help you create an Excel project timeline template that will work for you as a real tool.
Table of Contents
- The Components of an Effective Excel Timeline Template
- Creating a Gantt Chart in Excel – Step by Step Guide
- Styling Your Timeline for Optimum Clarity
- Applying Conditional Formulas for Tracking Project Progress
- Excel Timeline Templates That Are Worth Downloading
- When You Should Stop Using Excel
- Conclusion
What a Good Excel Timeline Template Includes
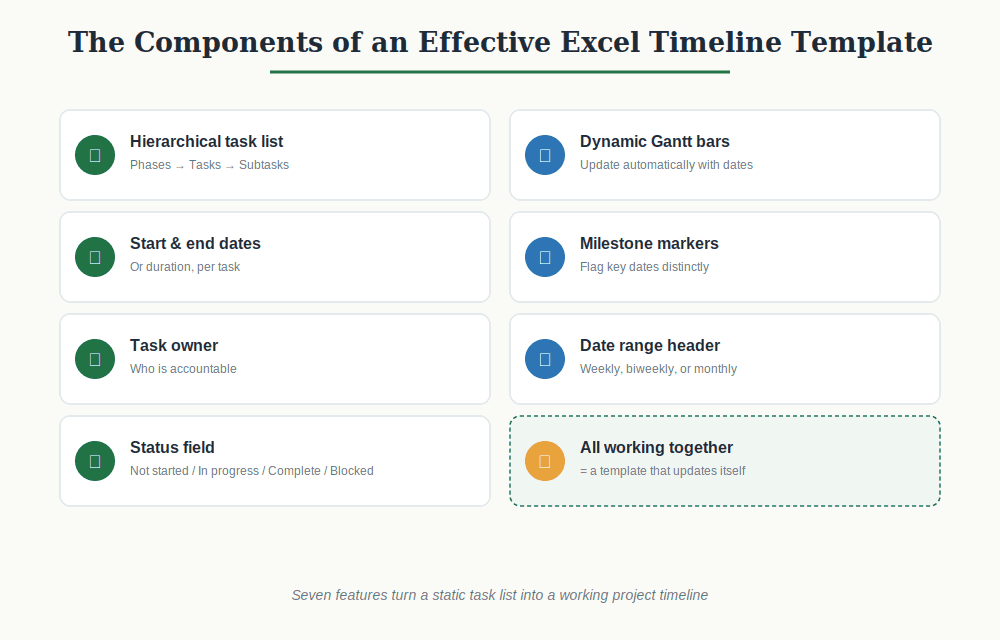
Identify the functions required from your template before creating it. The following features need to be present in an effective Excel project timeline:
- List of tasks in a hierarchy (phases -> tasks -> subtasks)
- Start date and end date (or duration) of each task
- Owner of each task
- Status of each task (Not started/In progress/Completed/Blocked)
- Timeline with Gantt bars updating dynamically with the change in date
- Milestone bar to mark important dates
- Header specifying the date range (weekly/biweekly/monthly according to project length)
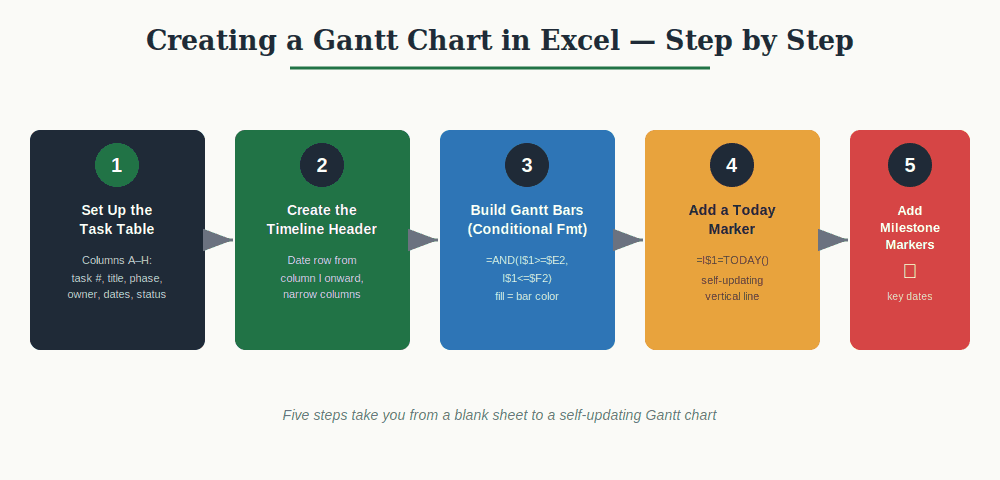
Building a Gantt Chart in Excel: Step by Step
Step 1: Set Up the Task Table
Prepare the following table columns:
- A: Task Number (1, 1.1, 1.2, 2, 2.1, etc.)
- B: Task Title
- C: Phase (the parent category)
- D: Owner
- E: Start date
- F: End date
- G: Duration (Formula =F2-E2+1)
- H: Status (dropdown – Not Started / In Progress / Complete / Blocked)
Step 2: Create the Timeline Header
On the right side of your task table (starting in column I or beyond), make a date header row.
In cell I1: Type in your starting project date
In cell J1: =I1+7 (or add 1, if viewing on a daily basis)
Then drag through to fill out the entire project period.
Apply a date format (“Jan 5,” or “Week 1”) to the header row and make the columns narrow (6 to 10 pixels wide).
Step 3: Build the Gantt Bars with Conditional Formatting
In the first line of task rows, pick the entire column with dates from I2 till the last cell in the timeline.
Navigate to:
Home → Conditional Formatting → New Rule → Use a formula
Apply this formula (adjusting cell references based on your column placement):
=AND(I$1>=$E2, I$1<=$F2)
Conditional format fill: select color for Gantt bars (blue is default, assign distinct color for each phase).
Duplicate the conditional format to every other line of tasks. Bars will dynamically display when the date header lies between task dates.
Step 4: Add a Today Marker
Create another conditional formatting formula for the same date column range:
=I$1=TODAY()
Fill format: select a unique color (red or orange). You get a vertical “Today” line that will update itself every day according to the date change.
Step 5: Add Milestone Markers
Milestone rows: Insert a diamond icon (◆) into the task description and make the row look distinct. Create a new conditional format for these rows with a different shade (darker/contrasting).
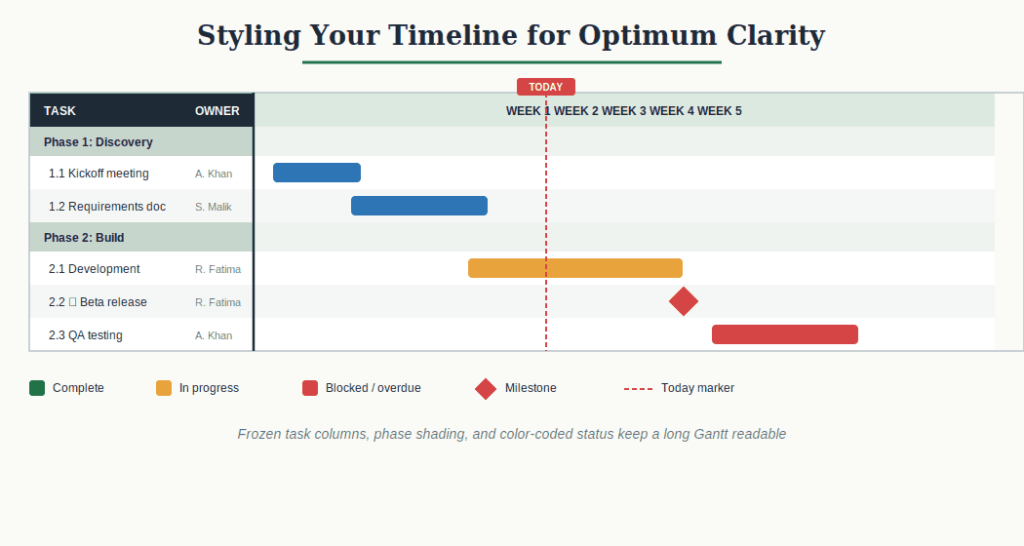
Formatting the Timeline for Readability
- Header row for date column: Bold font, centered, light color fill
- Phase rows: Bold font, darkened row fill (compared to tasks)
- Task rows: Regular weight font, alternating colors of rows
- Status column: Conditional format (Green – complete, Yellow – in progress, Red – blocked)
- Gantt chart: Freeze columns A-H in order not to lose the task list while scrolling right
Shrink data column size to 8-10 pixels for the weekly view, this way the Gantt will stay compact but the bars won’t be too small to see.
Adding Conditional Logic for Status Tracking
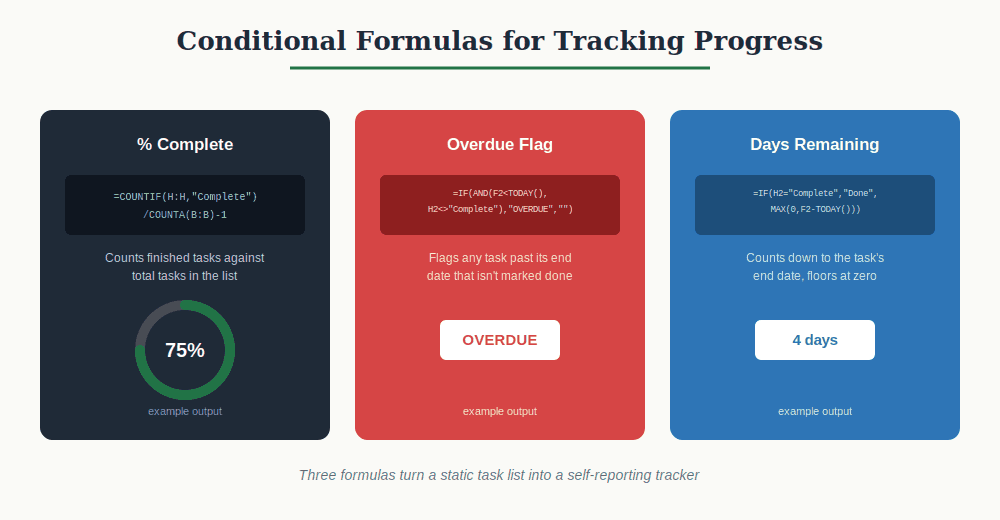
Insert these formulas to create an auto-populating Gantt template.
Auto-calculate % Complete (Column I)
=COUNTIF(H:H,”Complete”)/COUNTA(B:B)-1
(Adjust for your header row position.)
Overdue Flag (Column J)
=IF(AND(F2<TODAY(),H2<>”Complete”),”OVERDUE”,””)
Format this column with a red fill when the formula returns “OVERDUE.”
Days Remaining (Column K)
=IF(H2=”Complete”,”Done”,MAX(0,F2-TODAY()))
Free Excel Timeline Templates Worth Using
Rather than building from scratch, these are reliable starting points.
Microsoft Office Template Library
Excel’s built-in template gallery (File → New → search “project timeline” or “Gantt chart”) includes several functional templates. The “Agile Gantt Chart” and “Project Timeline with Milestones” templates are both solid.
Smartsheet Free Excel Gantt Templates
Smartsheet offers downloadable Excel Gantt templates with pre-built formatting and conditional logic at smartsheet.com/free-project-management-templates. Free to download without a Smartsheet account.
Vertex42
This is an extremely popular site for Excel project management templates. The Gantt Chart Template from vertex42.com is one of the most popular Excel Project Management templates, functional and easy to customize.
TeamGantt
Provides a free Excel Gantt Template that matches their online tool’s format. This can be helpful if you are considering their Gantt Tool at a future date.
When to Move Beyond Excel
Excel can be used in:
- Project schedules with a single PM owner per project
- Clear phase projects with sequential phases, where manual updates are feasible
- Stakeholder-focused project schedule views that have to be shared via email/print
Excel fails in situations where:
- Updating the timeline requires multiple people at the same time
- Tasks require automatic linking to resource calendars or budgeting
- Your project is constantly changing and manually updating becomes time-consuming
- You manage more than 2-3 projects at the same time
At that stage, it is time to use either Smartsheet (the most similar tool to Excel which provides project management capabilities), MS Project, or any other PM software.
Final Thoughts
The Gantt Chart Template for Excel developed appropriately can solve the majority of projects scheduling needs for those who don’t have the corresponding PM solution. The approach of using conditional formatting allows having the Gantt bars updated in accordance with your dates automatically, the Today column displays the status of your schedule at once, and status drop downs provide an easy way to monitor the progress of your work.