Email Marketing ROI Statistics: What the Data Actually Says
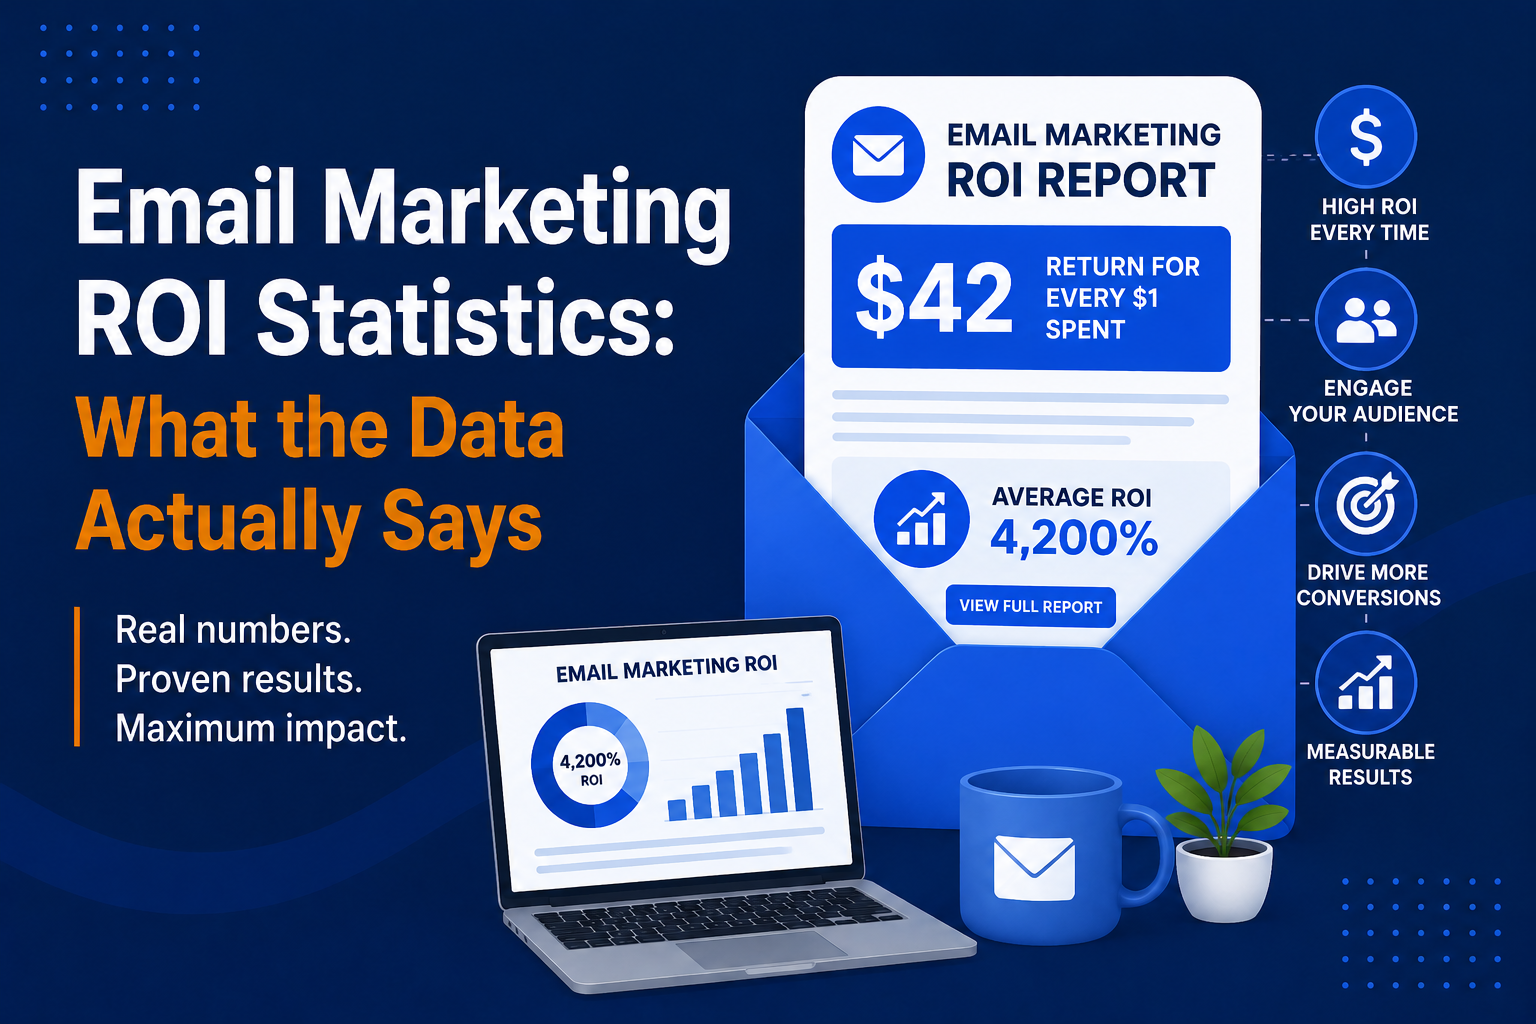
ROI on email marketing is one of the statistics used often in digital marketing, but it is also one of the most confusing and misunderstood statistics. Have you ever heard the “return of $36 for every $1 spent” statistic? How true is this statistic? This guide will discuss all about ROI on email marketing and how it compares from industry to industry and company to company.
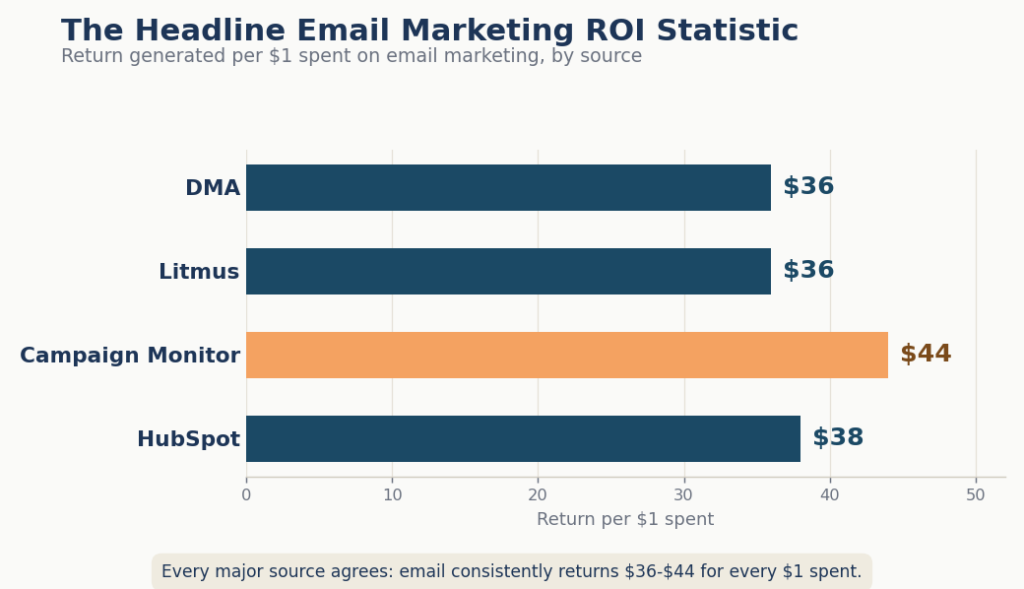
The Headline Email Marketing ROI Statistic
The most frequently cited number of ROI on email marketing campaigns has been provided by the Data & Marketing Association (DMA), stating that email produces an ROI of $36 for every dollar spent.
There are other reliable sources which cite ROI numbers close to the above one:
- Litmus: $36 ROI per $1 spent (based on State of Email report 2023);
- Campaign Monitor: $44 for every $1 spent (higher because of the difference in methods);
- HubSpot: 38:1 ROI on average (surveyed marketers).
All of them confirm the same thing, email has the greatest ROI in digital marketing compared to paid search, social media marketing and content marketing.
Email Marketing ROI by Industry
ROI differs widely across industries. It should be noted that industries with the highest email revenue generating capacity are industries where the average transaction value and purchasing frequency are relatively high.
Retail and Ecommerce
- Among the best email ROI of any industry
- Email generates 25-30% of overall revenue for many ecommerce firms
- Automated campaigns (abandoned carts, post-purchase) generate an excessive amount of revenue from emails
- Average ROI: $45-$60 for every dollar spent
B2B
- Longer sales cycles lead to low direct attributability from email campaigns
- Email ROI is usually based on pipeline influence, not revenue
- The use of lead nurturing can cut sales cycle duration by 23% (Marketo study)
- Average ROI: Very high, the best campaigns achieve 20–40x return on investment
Financial Services
- Large transaction values increase ROI
- Regulatory demands hinder program complexity
- Average ROI: High, particularly for insurance and investment emails
Travel and Hospitality
- High seasonal fluctuation
- Emails from loyalty programs offer high ROI
- Booking cancellation emails prove to be very effective
Publishing and Media
- Email is mostly used for subscription acquisition and retention
- Email newsletters with paid subscriptions can bring high income per subscriber
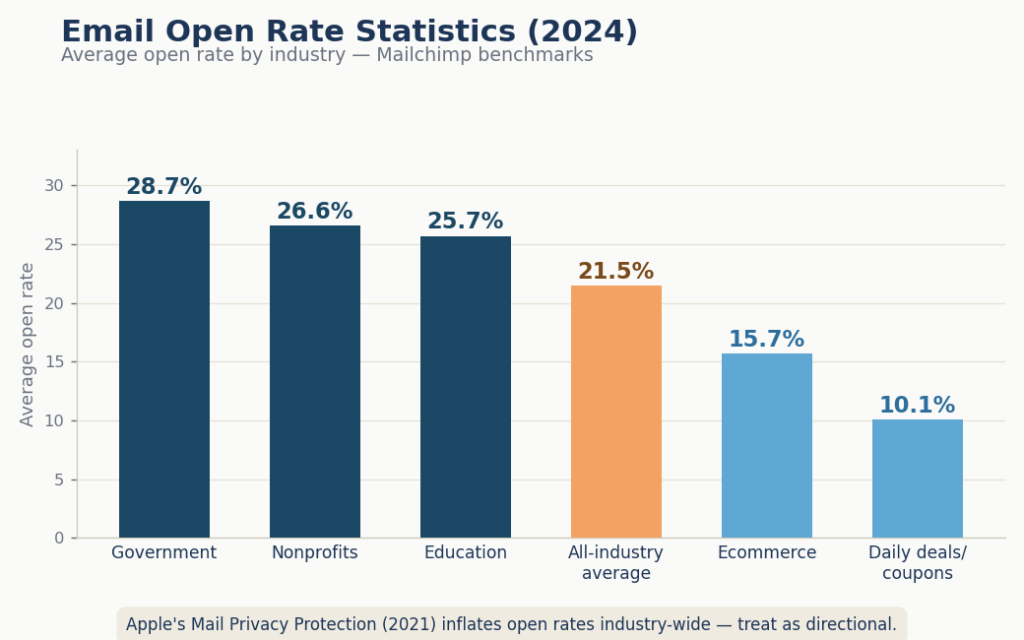
Email Open Rate Statistics
Benchmarks for email open rates (2024, in any industry):
- Average email open rate: 21.5% (Mailchimp industry benchmarks)
- The highest open rates: Government (28.7%), Nonprofits (26.6%), Education (25.7%)
- The lowest open rates: Daily deals/coupons (10.1%), Ecommerce (15.7%)
Important Note on Open Rate Measurement
The Mail Privacy Protection that was introduced in 2021 by Apple has increased the open rate for everyone due to pre-loading of pixels in emails. Open rates have become directional because of MPP since most email marketers view them as such now.
Email Click-Through Rate Statistics
Average CTR benchmark rates
- Industry standard: 2.3% (Mailchimp)
- B2B emails: 2-5% CTR
- Ecommerce marketing emails: 1-3% CTR
- Behavioral automatic emails: 5-15% CTR (much higher compared to broadcast emails)
The difference in click rates between automated and broadcast emails is one of the most convincing reasons to build automation infrastructure.
Email Automation ROI Statistics
Automated emails always outdo broadcast campaigns in all the measures. The ROI disparity is quite large.
Welcome Email Statistics
- Open rate: 50-80% (compared to 21% for broadcast campaigns)
- Click rate: 14-25%
- Revenue generated by each email: 3 times the standard promotional emails
Abandoned Cart Email Statistics
- Open rate: 40-50%
- Abandoned cart recovery rate: 5-15% of the total cart abandonment rate
- Revenue effect: Cart abandonment emails are the top revenue generator for ecommerce businesses
Post-Purchase Email Statistics
- Review Request Emails have open rates exceeding 40%
- Upsell Campaigns that are triggered 7-14 days after the purchase convert 2-4 times faster compared to Cold Email Campaigns
Re-Engagement Email Statistics
- 10-15% of inactive subscribers get re-activated with a great Re-Engagement Campaign
- The Cost of a Re-Engagement Campaign is much less than the cost to acquire an equal number of subscribers
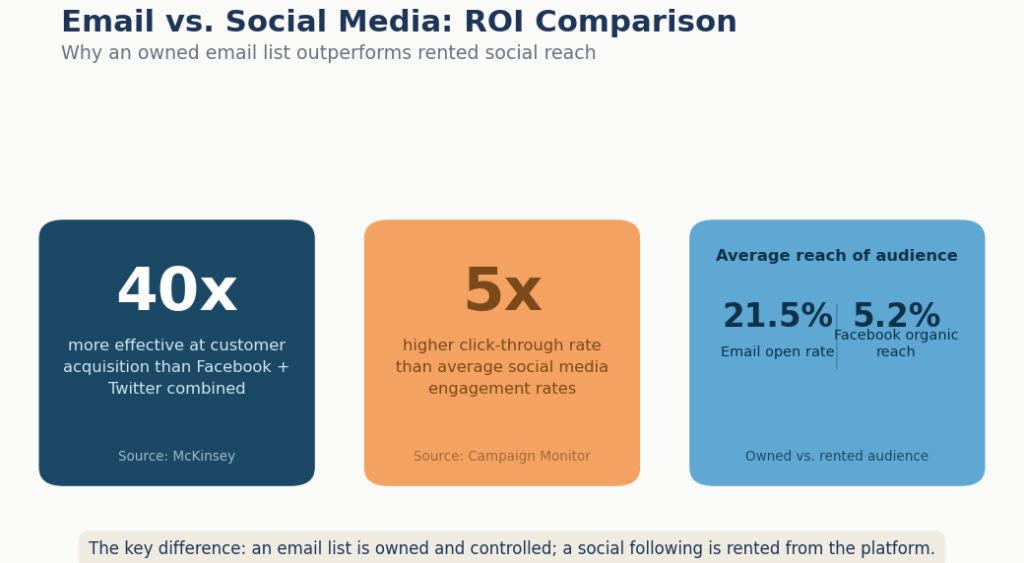
Email vs. Social Media: ROI Comparison
The numbers continue to support that email marketing works better for ROI.
Key Comparison Statistics
- Email is 40 times more effective at customer acquisition compared to Facebook and Twitter combined (McKinsey).
- Email CTRs are five times better than social media interaction rates (Campaign Monitor).
- Organic reach on Facebook is only 5.2% of your fanbase; average email open rate is 21.5%.
The key difference? Email list = owned audience; social media audience = rented audience.
Email List Growth Statistics
- Email lists lose up to 22.5% annually due to unsubscribes, bouncing emails, and inactive members (HubSpot).
- This implies that one should increase their list by more than 22.5% per annum just to stay at the same level.
- Using a series of welcome emails lowers the list attrition rate by 30-40%, compared to using a single welcome email.
Email ROI by Campaign Type
But not all emails bring in the same results. Check out the differences between campaign types:
Automated Behavioral Emails
- Highest ROI of any email type
- Triggered by specific actions (purchase, abandonment, inactivity)
- Higher personalization = higher performance
Promotional/Sale Emails
- Second Highest ROI
- Flash promotions create a high amount of revenue in a short period of time
- Subscribers may become trained to wait for discounts
Newsletter/Content Emails
- Lowest Direct ROI but the greatest effect on building engagement on the mailing list
- Engaging subscribers tend to convert better over time
Re-Engagement Campaigns
- Underused by the majority of email marketing tools
- 10-15% conversion rate for inactive subscribers
- Usually yields positive ROI after considering lower list acquisition cost and higher delivery rates
How to Calculate Your Email Marketing ROI
The Formula
ROI of Email Marketing = [(Revenue from Email Campaign – Cost of Email Campaign) / Cost of Email Campaign] × 100
Cost of Email Program Includes
- ESP monthly subscription
- Time of staff members (hourly rate or salary)
- Copywriting and designing (internal or outsourcing)
- Other paid tools used
Revenue Generated from Email
- Use UTM tags in all emails to capture data in Google Analytics
- Define email as an attribute in your attribution modeling
- Revenue is directly tracked by ESPs in the case of automation
Example Calculation
- Program cost per month: $2,500 (software + time of staff + agency)
- Revenue attributed to emails per month: $35,000
- Return on investment: (35,000 – 2,500) / 2,500 * 100 = 1,300%
Final Thoughts
The numbers speak for themselves regarding ROI for email marketing campaigns, and the stats will work regardless of your industry, company size, or type of campaign that you use. However, the aggregate numbers alone will not paint a full picture; the effectiveness of your program and ROI depend on your list, your segmentation, automation, and execution.
These benchmarks will help you assess your current results and find ways to improve your campaign and justify further investments in the future.